HR Analytics Explained
The following section is a guide to HR Analytics, along with some practical examples. A short explainer video accompanies the text.
Part 1: Employee Lifecycle and Retention Analysis
Employee Life Cycle
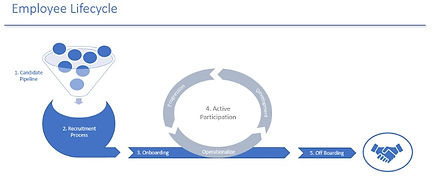
The starting point for firms is assessing what data they store surrounding the Employee Lifecycle. The Employee Lifecycle can mean different things to different people; the following graph illustrates how we view it:
Employee Lifecycle Stages
-
Candidate Pipeline - how did an employee come to you as a potential candidate in the first place? Did they apply via the company website, a third-party recruitment firm, or was the candidate referred by an existing employee of the company? Maybe a specific marketing campaign was conducted to attract potential employees?
-
Recruitment Process - When the candidates make it to the interview stage, what data is stored about the recruitment process? For example, what was the lead time between a candidate being notified they had made it to this stage versus the interview taking place? How many interviews were there and how long does the whole process take?
-
Onboarding – Once the employee accepts an offer of employment, how long until they begin production? How long is training, and how many trainers are involved?
-
Active Participation – Now that the employee is embedded within the organisation, actively contributing to the team, there are three areas that they need support: in how they operate day-to-day, how they develop, and how they progress to the next level. Depending on the industry, the company, and the current data infrastructure, there are different questions that can be asked, benchmarks that can be created, and insights that can be derived.
-
Off Boarding – when an employee decides to leave a company, what is the process surrounding that? What was the tenure of the employee, and what level within the company where they when they decided to leave?
Ideally, an organisation would store data for all the stages outlined above. But even with some simple data, significant insights can be derived and actioned on. For example, just having the start date and end date for employees, and whether they're currently active or not, can allow us to conduct Retention Analysis.
Retention Analysis Example
Let’s assume your organization recently ran two recruitment campaigns, one in 2020 and one in 2021. How do you determine which campaign was more effective? A useful metric could be to assess the tenure profile of employees hired in each campaign – Retention Analysis. This allows us to assess whether there’s a statistically significant difference between the retention profile of each group, and are there any identifiable driving factors. The output from a retention analysis might visually look like the following chart
As one might expect – although its not always the case - 100% of staff hired in each intake were still employees at the end of their first day. At the other end of the series, we can see that only 20% of the 2021 intake make it to 180 days of tenure, whereas for the 2020 intake, 40% made it to 180 days. That’s a significant difference right away, and we can start diving deeper into why that might be the case.
For the 2021 intake, the problems began quite quickly – there’s a steep decline in the first two weeks, with 20% of the workforce having left by this point in their tenure. This compares to the 2020 intake, who didn’t lose 20% of their workforce until five weeks have passed.
Are there any identifiable factors about why this was the case? Potential reasons could be the campaign ad, the recruitment or onboarding process, the geographical location, or, indeed, chance. It’s worth remembering that the retention profile would differ depending on the industry you operate in. Industry benchmarks can be very useful in providing context.
This analysis of fairly simple data – the start date and end date of employees – gives us specific actionable areas to focus on the retention of staff and cost savings.
In the next section (here), we look at how analytics can help management pinpoint and prioritise areas for improvement in team performance.